Topic 4.1 - Individuals, firms, markets and market failure
![AQA ECONOMICS A-LEVEL SPECIFICATION SYLLABUS TOPIC 4.1 [MARGINAL AVERAGE AND TOTAL REVENUE]](https://images.squarespace-cdn.com/content/v1/55b690f2e4b076db679cd340/40f5a743-b399-4054-926d-c963042eaa05/AQA+ECONOMICS+A-LEVEL+SPECIFICATION+SYLLABUS+TOPIC+4.1+%5BMARGINAL+AVERAGE+AND+TOTAL+REVENUE%5D)
Snapshot of the AQA syllabus topic area we’ll be covering in this post.
MARGINAL, AVERAGE AND TOTAL REVENUE: PRODUCTION, COSTS AND REVENUE
AQA students must understand the following content [taken from the syllabus]
The difference between marginal, average and total revenue.
Why the average revenue curve is the firm’s demand curve.
The relationship between average and marginal revenue.
The relationship between marginal revenue and total revenue.
INFORMATION YOU NEED TO KNOW
[SUPPORTING DIAGRAMS AND QUESTIONS AT THE BOTTOM OF THIS PAGE]
Introduction:
Understanding the terms marginal, average, and total revenue is essential for studying how businesses generate money and make decisions in the field of microeconomics. Each of these revenue measurements offers insightful information about a company's income sources and aids in choosing the best pricing and production tactics. The definitions and differences between marginal, average, and total revenue will be covered in detail in this article, along with the relationships between average revenue and the firm's demand curve, average and marginal revenue, and the relationships between marginal and total revenue.
1. Marginal, Average, and Total Revenue:
The difference in total income brought on by the sale of one extra unit of a good or service is known as marginal revenue (MR). It is derived by dividing the difference in quantity of sales by the difference in total revenue. Calculating average revenue (AR), commonly referred to as revenue per unit, requires dividing total revenue by the number of units sold. Total revenue (TR), which is derived by dividing the price per unit by the number of units sold, is the overall income an organisation receives from the sale of its goods or services.
2. The Average Revenue Curve as the Firm's Demand Curve:
Due to the different market structures and levels of competition, the average revenue curves in competitive and monopoly markets show notable differences.
In a competitive market:
Horizontal Average Revenue Curve: In a market with perfect competition, many businesses offer the same goods, and no business has a monopoly on the market price. Since the demand curves for each firm are perfectly elastic, the average revenue curve at the market price is horizontal. This is due to the fact that a firm in a competitive market can sell any amount of output at the going rate without changing it.
Price-Taker: Firms in a competitive environment are price-takers, which means they have no influence on market prices. The price is determined by the forces of supply and demand in the market, and businesses modify their output levels to increase their profits.
Average Revenue = Marginal Revenue = Price: In a market wherever there is competition, average revenue is the same as marginal revenue, which is the same as the market price. Each company deals with an elastic demand curve, so every additional unit sold results in the same revenue.
In a monopoly market:
Downward Sloping Average Revenue Curve: Market power and a downward-sloping demand curve are two characteristics of monopolistic firms. Being the sole supplier, it has control over the output and, as a result, the market price. Because the company must cut the price to sell more units, the average revenue curve in a monopoly market slopes downward.
Price-Setter: A monopolistic firm can establish prices and have an impact on market prices. By establishing a price where marginal revenue equals marginal cost, it chooses the output volume to maximise its profits.
3. The Relationship between Average and Marginal Revenue:
Average revenue (AR) and marginal revenue (MR) have a close relationship. Because the company must sell each unit at the going market price in perfect competition, where the firm is a price taker, the average revenue stays constant. The average revenue curve is therefore a horizontal line. Marginal revenue is equal to average revenue under perfect competition since it depicts the change in total revenue brought on by the sale of one additional unit. The marginal revenue curve thus corresponds with the average revenue curve in a market with perfect competition.
4. The Relationship between Marginal Revenue and Total Revenue:
Understanding the principles of revenue maximisation depends on the link between marginal revenue (MR) and total revenue (TR). Marginal revenue shows how the overall revenue has changed with each extra unit sold. Selling an extra unit results in a positive contribution to total revenue if marginal revenue is positive. Selling an extra unit, on the other hand, brings down total revenue if marginal revenue is negative. In order to maximise overall income, businesses produce at the level where either marginal revenue is zero or equals marginal cost.
Conclusion:
Firms may analyse revenue methods of production, decide on pricing, and increase their profitability by having a thorough understanding of the intricacies of marginal, average, and total revenue. In order to succeed over the long term, businesses may create efficient pricing strategies, maximise production levels, and successfully navigate the competitive market environment by understanding the links between these revenue measurements and the implications for demand.
SUPPORTING DIAGRAMS

average revenue curve where a firm has price making power (like a monopoly for example)
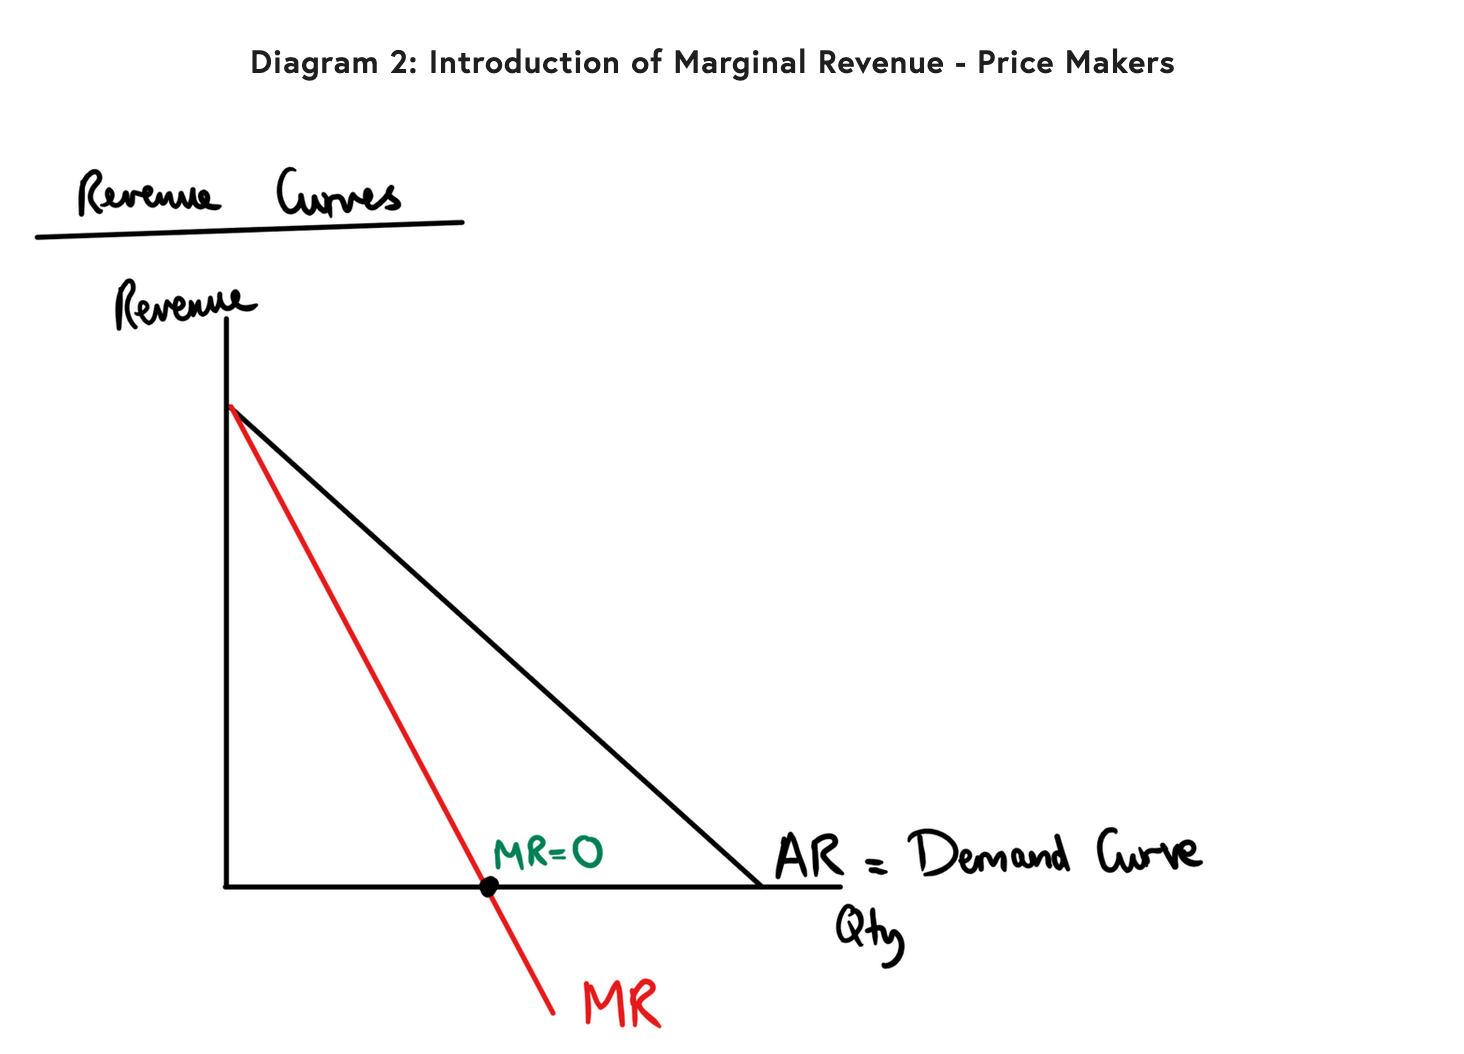
average revenue and marginal revenue curves where a firm has price making power

total revenue curve where a firm has price making power

average revenue and marginal revenue curve where a firm is a price taker such as in a competitive market

total revenue curve in a competitive market, where firms are assumed to be price takers
EXAMPLE QUESTIONS WITH SOLUTIONS TO HELP YOU CALCULATE AVERAGE, MARGINAL AND TOTAL REVENUE
Question 1: A firm sells 100 units of a product at a price of £10 per unit. Calculate the total revenue, average revenue, and marginal revenue.
Solution:
Total Revenue = Price per unit x Quantity Sold Total Revenue = £10 x 100 = £1000
Average Revenue = Total Revenue / Quantity Sold Average Revenue = £1000 / 100 = £10
Marginal Revenue = Change in Total Revenue / Change in Quantity Sold Since the quantity sold remains constant at 100 units, the marginal revenue is also £10.
Question 2: A firm reduces the price of its product from £20 to £15, resulting in an increase in quantity sold from 50 units to 70 units. Calculate the marginal revenue for the additional 20 units sold.
Solution:
Change in Total Revenue = New Total Revenue - Old Total Revenue Change in Total Revenue = (£15 x 70) - (£20 x 50) = £1050 - £1000 = £50
Marginal Revenue = Change in Total Revenue / Change in Quantity Sold Marginal Revenue = £50 / 20 = £2.50
Question 3: A firm observes the following data: at a price of £8, it sells 200 units; at a price of £6, it sells 300 units. Calculate the total revenue, average revenue, and marginal revenue for each price level.
Solution:
For a price of £8:
Total Revenue = £8 x 200 = £1600
Average Revenue = £1600 / 200 = £8
Marginal Revenue = Change in Total Revenue / Change in Quantity Sold
Marginal Revenue = (£8 x 200) - (£8 x 200) = £0
For a price of £6:
Total Revenue = £6 x 300 = £1800
Average Revenue = £1800 / 300 = £6
Marginal Revenue = Change in Total Revenue / Change in Quantity Sold
Marginal Revenue = (£6 x 300) - (£8 x 200) = £600 - £400 = £200